Building a Real-Time Analytics Pipeline: Aiven Kafka to ClickHouse and Grafana
Last updated: November 2026
Batch reports are useful for historical analysis. For this project, I wanted a dashboard that changed as new events arrived. I built a small user-activity analytics pipeline with Apache Kafka on Aiven, ClickPipes for ingestion into ClickHouse Cloud, and Grafana for visualization.
The source was generated sample activity, not live customer traffic. The screenshots record one demonstration run; their counters are observations at capture time, not throughput or latency benchmarks.
The pipeline
Aiven Kafka sample events
        |
        v
ClickPipes
        |
        v
ClickHouse Cloud
  bronze: ingested events
  silver: cleaned user activity
  gold: minute-level reporting view
        |
        v
Grafana User Activity Analytics
The managed ingestion service meant I did not need to write a custom Kafka consumer. The database layers separated ingestion, cleanup and reporting, while Grafana provided the dashboard.
Step 1: Create an Apache Kafka service on Aiven
I selected Apache Kafka in Aiven's service catalog and provisioned a managed service. Kafka provides the event stream between the sample producer and ClickHouse.
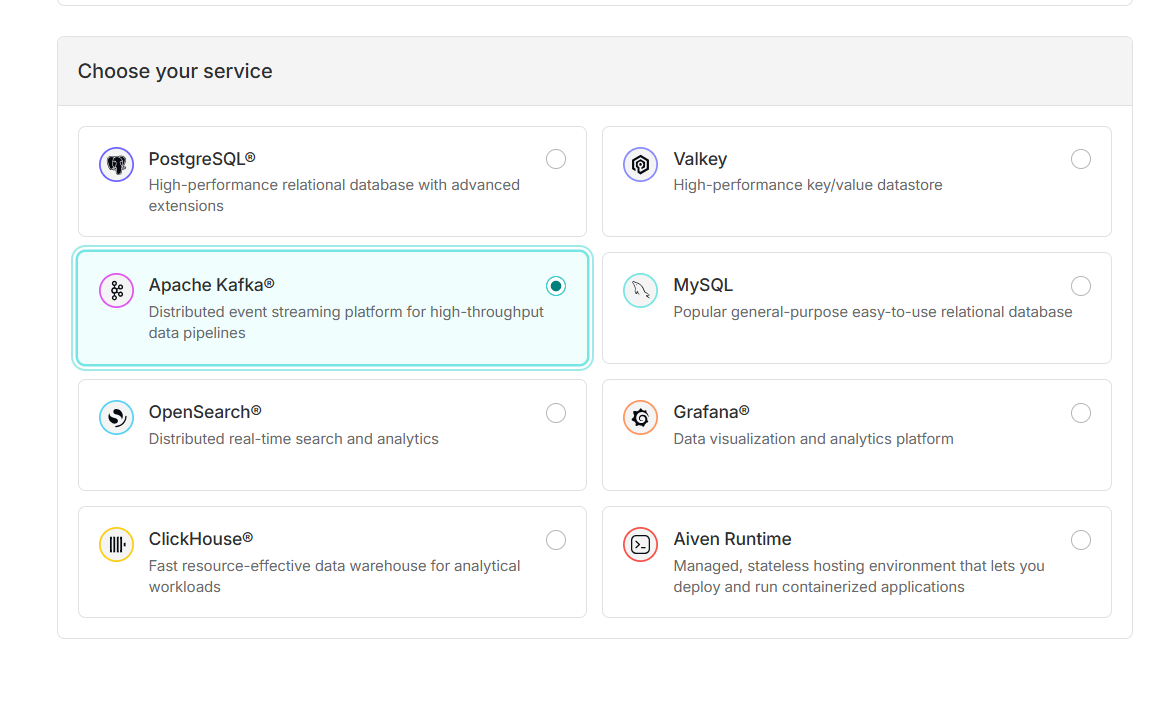
The captured account showed a $50 trial balance with 30 days remaining. That was the offer shown for this account at the time, not a promise of current pricing or a guarantee that every experiment will be free. Check the applicable plan, credits and service costs before starting.
Step 2: Start a sample data stream
The service overview provides the broker connection information needed by ClickPipes. The screenshot below shows the service while it was still provisioning; wait until the service is ready before testing the connection.
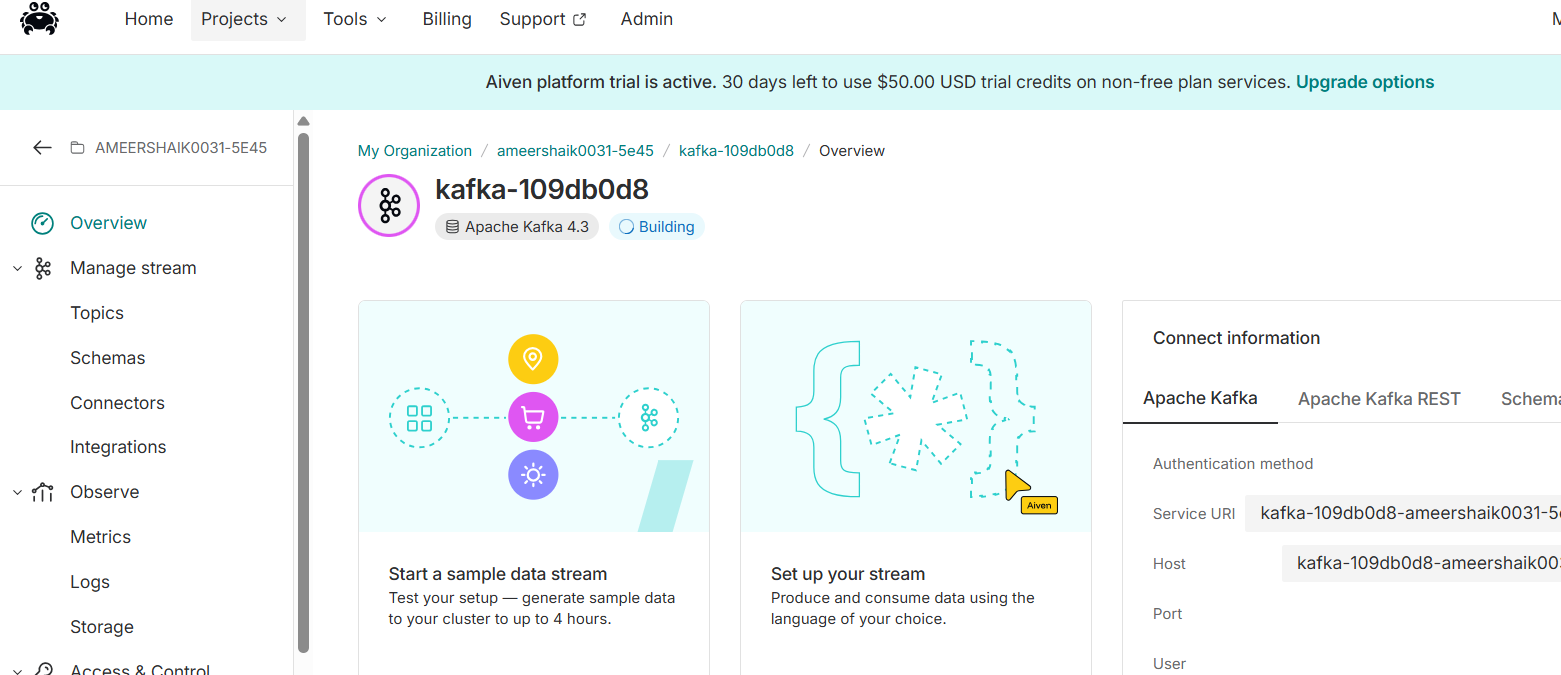
Aiven's sample data generator is useful when there is no application producer yet. Its documented session duration ranges from 15 minutes to four hours. The generator is a temporary test source, so a dashboard will stop receiving new sample events when the session ends. Aiven sample-data documentation
For a real application, replace it with a producer and define the event schema, topic retention and access permissions deliberately.
Step 3: Connect Kafka to ClickHouse with ClickPipes
In ClickHouse Cloud, I opened Data sources, created a ClickPipe and selected Apache Kafka. The connection form collects the broker and authentication settings:
- ClickPipe name: a descriptive name for the ingestion job.
- Consumer group: the generated group or a dedicated group chosen for this pipeline.
- Brokers: the Aiven hostname and port for the selected authentication method.
- Authentication: SASL/PLAIN with the service user's credentials, over TLS.
- CA certificate: the certificate needed to verify the Kafka broker's TLS connection.
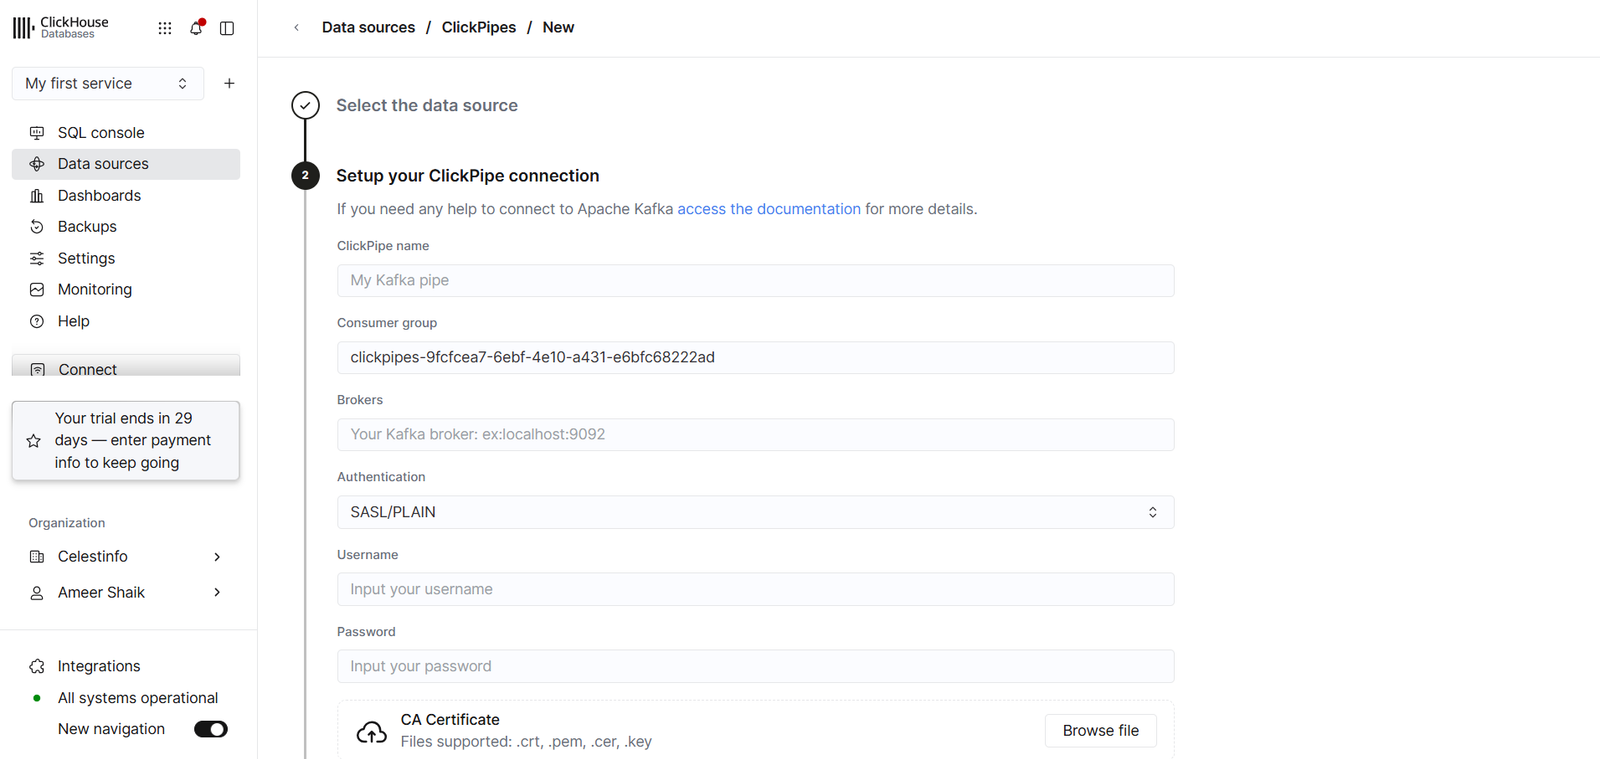
Enable SASL on the Aiven service if it is not already enabled. Aiven uses different ports for SASL and client-certificate authentication; use the SASL endpoint with SASL/PLAIN. Do not disable certificate verification to work around a connection error. Aiven SASL configuration
The connection is only part of the setup. Select the actual source topic, configure its message format and schema handling, and map fields to the ClickHouse destination. If the sample topic uses Avro with a schema registry, configure the corresponding registry connection rather than treating those messages as JSON.
After configuration, the ClickPipe named user_activity_data_gen showed Running, with 2,758 records and approximately 34.78 KB displayed in the console.
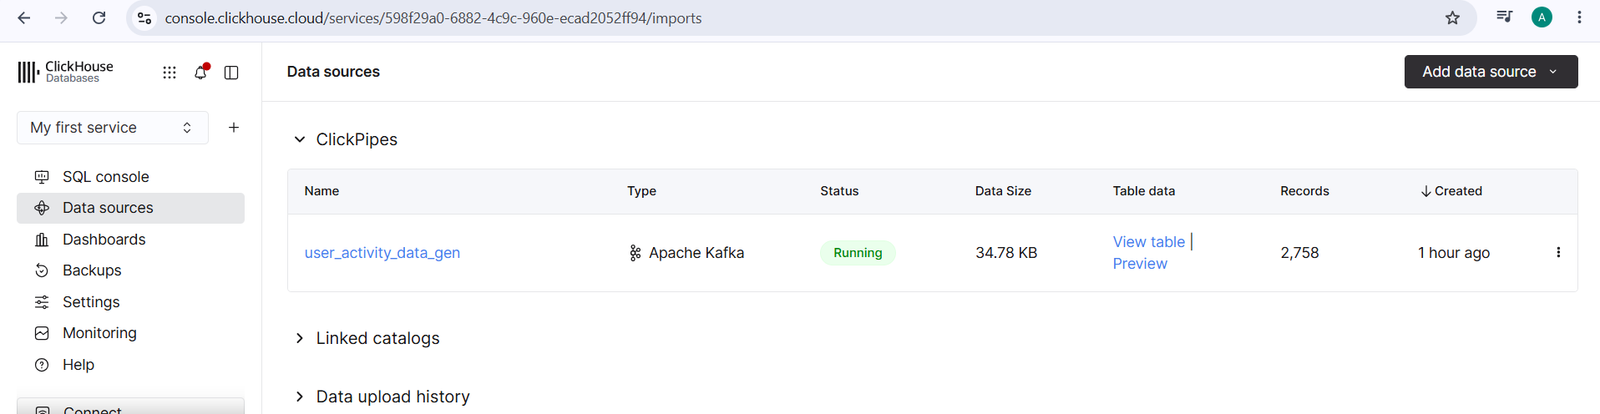
These counters establish that the console reported ingestion activity. They do not measure end-to-end freshness or prove that every source event was reconciled. Delivery settings and duplicate handling should be reviewed before relying on event counts in production.
Step 4: Separate bronze, silver and gold
I organized the data into three logical layers:
| Layer | Purpose in this project |
|---|---|
| Bronze | Land the ingested source events. |
| Silver | Provide cleaned, typed user-activity fields in SILVER_DB.user_activity. |
| Gold | Expose a reporting query grouped by minute, country, page and action. |
The SQL below assumes the silver table already exists and contains event_time_utc, country_code, page and action. The timestamp should be typed and normalized consistently to UTC. The supplied project notes do not include the bronze schema or the bronze-to-silver transformation, so this is the reporting-layer example rather than a complete ingestion deployment script.
CREATE DATABASE IF NOT EXISTS gold;

CREATE VIEW IF NOT EXISTS gold.user_activity_minute AS
SELECT
    toStartOfMinute(event_time_utc) AS minute_utc,
    country_code,
    page,
    action,
    count() AS event_count
FROM SILVER_DB.user_activity
GROUP BY minute_utc, country_code, page, action;
This is an ordinary view, not a stored rollup. It runs the aggregation when queried and does not persist pre-aggregated rows. It centralizes the dashboard's reporting logic; it does not, by itself, eliminate scans of the underlying events. For larger workloads, consider a materialized-view design after measuring the queries. ClickHouse view documentation
Give Grafana a restricted reporting identity
I created a dedicated reader instead of connecting Grafana with an administrative account. Run the following as an appropriately privileged setup user, using a new strong password in place of the placeholder:
CREATE USER grafana_gold_reader
IDENTIFIED WITH sha256_password BY '<strong-password>';

-- The definer must retain SELECT permission on the silver source.
-- Use a suitably restricted owner for a production deployment.
ALTER TABLE gold.user_activity_minute
MODIFY SQL SECURITY DEFINER DEFINER = CURRENT_USER;

GRANT SELECT ON gold.user_activity_minute TO grafana_gold_reader;

CREATE SETTINGS PROFILE grafana_gold_readonly
SETTINGS
    readonly = 1,
    max_execution_time CHANGEABLE_IN_READONLY
TO grafana_gold_reader;
The explicit definer setting matters: it lets the view read its source with the owner's permissions while Grafana receives access to the reporting view. The original screenshot includes this step. Without it, an ordinary view running with invoker permissions can require the reader to have access to the source as well.
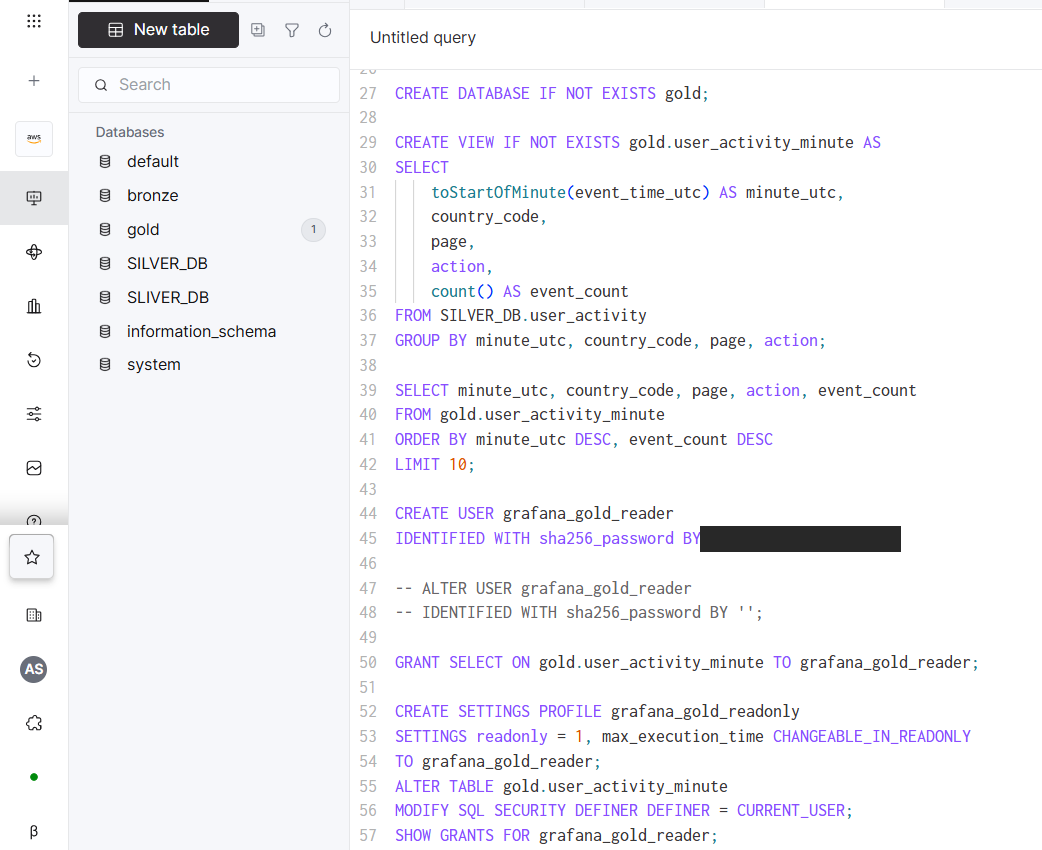
Grafana's ClickHouse plugin needs to set max_execution_time to enforce query timeouts, which is why that setting is changeable in the read-only profile. Grafana connection and permission guidance
The grants narrow access to the reporting data; they are not an absolute security guarantee. Check the user's effective roles and grants, and test both a permitted view query and a denied direct-source query using that identity. Keep credentials in Grafana's secure data-source configuration and use TLS for the ClickHouse connection.
Step 5: Build the Grafana dashboard
I connected Grafana to ClickHouse with the dedicated reader and built a User Activity Analytics dashboard. Its selected time range was the last 24 hours, with a five-second dashboard refresh.
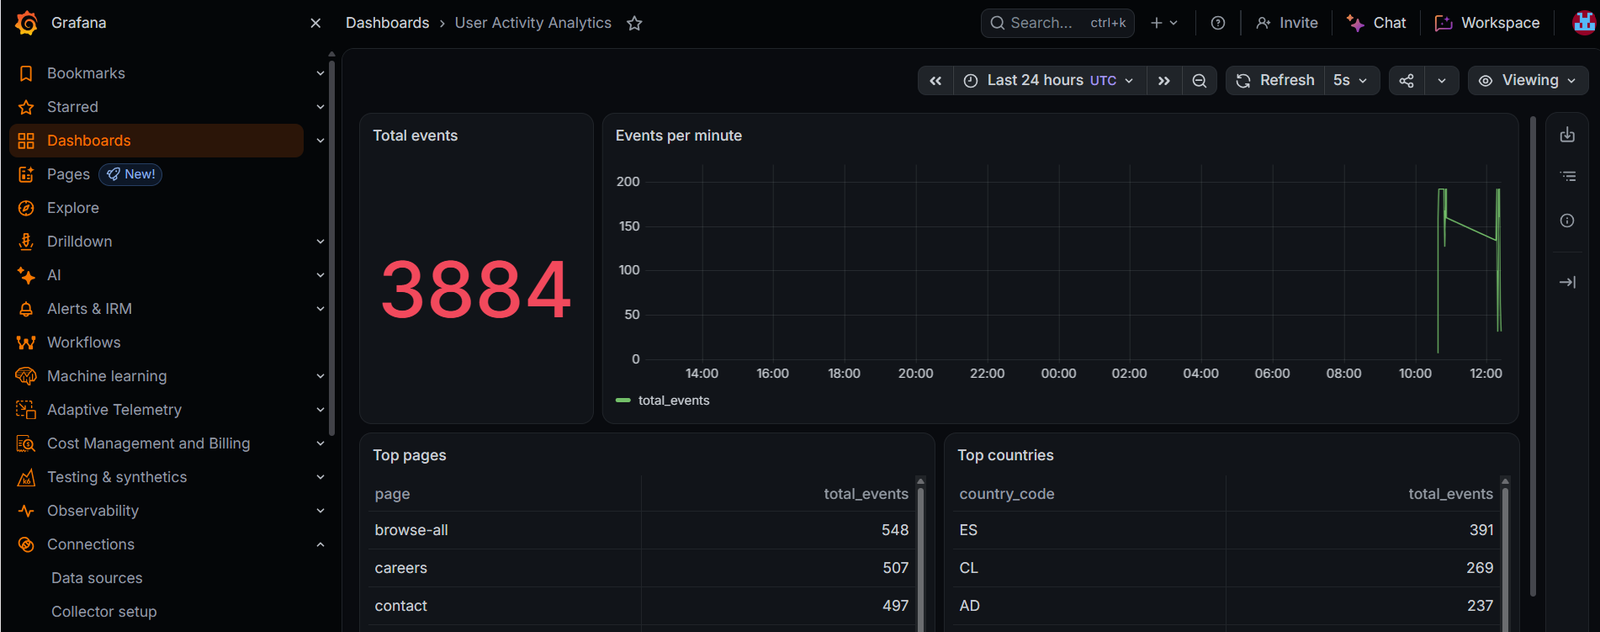
The four panels showed:
- Total events: 3,884 at capture time.
- Events per minute: activity grouped into minute buckets.
- Top pages:
browse-all(548),careers(507) andcontact(497) led the displayed results. - Top countries: ES (391), CL (269) and AD (237) led the displayed results.
The dashboard and ClickPipes screenshots were taken at different times. Their totals are not a same-instant reconciliation.
When querying the gold view, sum event_count to count source events. Counting the view's rows would count groups. For example, the following query returns minute totals over a fixed 24-hour window:
SELECT
    minute_utc AS time,
    sum(event_count) AS total_events
FROM gold.user_activity_minute
WHERE minute_utc >= now('UTC') - INTERVAL 24 HOUR
GROUP BY minute_utc
ORDER BY minute_utc;
For an interactive Grafana dashboard, bind every panel to the dashboard's selected time range rather than leaving a fixed SQL window. Minute-bucket filtering gives minute-level boundaries; use event-level timestamps where exact partial-minute boundaries matter.
A five-second refresh is how often Grafana queries. It is not a measured five-second ingestion latency. End-to-end freshness also depends on the producer, Kafka, ClickPipes and query execution.
What this demonstration establishes
The supplied screenshots show a running ClickPipe and a populated Grafana dashboard over generated activity. They document a useful path from a managed event stream to a reporting interface.
They do not establish sustained throughput, exact ingestion latency, replay correctness or production readiness. Before extending the project, verify source-to-destination counts over the same window, timestamp parsing, malformed-message handling, reader permissions and behavior after restarting the sample stream or ingestion job.
Key takeaways
- Managed ingestion reduced custom code. Aiven hosted Kafka and ClickPipes handled the consumer integration.
- Layers separated responsibilities. Ingestion, cleanup and dashboard definitions had distinct places in the model.
- An ordinary view is a reporting abstraction. Persisted rollups require a different storage design.
- Reader permissions need an explicit view-security model. A reporting-only grant and the correct definer configuration belong together.
- Dashboard refresh and data freshness are different measurements. A live-looking chart still needs ingestion monitoring.
What's next
- Add Grafana alerts for traffic spikes and drops.
- Add per-action trends and conversion-funnel reporting with clear event definitions.
- Replace the sample generator with an application producer.
- Measure end-to-end freshness and evaluate materialized rollups as volume grows.