What we learned building live payment analytics with ClickHouse and Grafana
From generated payment events to operational dashboards and AI-assisted investigation
A payment operations dashboard needs to answer practical questions: Are payments succeeding? Which provider or payment method is struggling? How much unpaid order value needs attention? What evidence should an operator check next?
We built a demonstration around those questions using ClickHouse Cloud, Grafana Cloud, and the native ClickHouse AI assistant. The project started with a dashboard request and developed into a working payment analytics pipeline with repeatable incidents, retry handling, shared metric definitions, and natural-language investigation.
The source is generated demo data. AlphaPay and BetaPay are fictional providers, and no actual customer or payment-provider system is connected. The records change inside ClickHouse on a schedule. That scope made it possible to test the analytical behavior without processing real payments.
The architecture
The running pipeline has six stages:
SQL scenario generator inside ClickHouse
                  |
                  v
Refreshable materialized view every 15 seconds
                  |
                  v
Stored rolling payment_attempts snapshot
                  |
                  v
Latest order state and provider health views
                  |
                  v
Saved SQL queries and investigation rules
          /               |                \
         v                v                 v
Grafana dashboard  ClickHouse dashboard  ClickHouse AI assistant
The database, revenue_demo, lives in our existing ClickHouse Cloud service. A refreshable materialized view generates a rolling hour of payment activity every 15 seconds. Ordinary SQL views turn those attempt records into order-level metrics and provider health indicators.
Grafana connects to ClickHouse through the official ClickHouse data-source plugin over HTTPS with TLS. The native ClickHouse dashboard runs saved queries within the same service. The AI assistant uses the same demo data for investigation.
This implementation has no Postgres source or WalShadow replication. Those would be additional ingestion components for a different version of the project.
A scenario that produces something worth investigating
Steady successful payments would make a poor operational demonstration. We needed a repeatable change that would appear in the charts and produce a meaningful investigation.
The SQL generator creates approximately four orders per simulated second, giving 14,400 unique orders in the rolling hour. Each order has a provider, payment method, region, INR amount, payment status, error code, and latency. Attempt IDs are distinct from order IDs so retries remain visible.
The simulation includes:
- Normal payment activity across AlphaPay and BetaPay, using UPI and Card.
- A recurring AlphaPay UPI degradation lasting two minutes in an eight-minute cycle.
- Elevated latency and
PROVIDER_TIMEOUTerrors during that degradation. - A successful retry through BetaPay after 45 seconds for a subset of failed orders.
Stable IDs and deterministic hashes preserve an order's identity across successive snapshots. Separate hash inputs control provider, method, region, and retry eligibility.
The scheduled refresh is simple:
CREATE MATERIALIZED VIEW IF NOT EXISTS revenue_demo.refresh_payments
REFRESH EVERY 15 SECOND
TO revenue_demo.payment_attempts
AS
SELECT *
FROM revenue_demo.generated_attempts;
Each refresh replaces the stored snapshot. It does not append a new copy of the entire hour, and it is not a measurement of external event-ingestion throughput.
Why order state matters as much as attempt status
One of the first design decisions was to distinguish a failed attempt from an unpaid order.
Consider an order that fails on AlphaPay and succeeds on a later BetaPay attempt. The failure still matters when measuring AlphaPay's attempt success rate. The order should no longer contribute to unpaid order value.
We used a view that groups attempts by order and selects the latest status. The implementation uses both the attempt timestamp and attempt ID to resolve ordering:
SELECT
    order_id,
    argMax(status, tuple(attempt_time, attempt_id)) AS latest_status,
    argMax(provider, tuple(attempt_time, attempt_id)) AS latest_provider,
    max(attempt_time) AS latest_attempt_at
FROM revenue_demo.payment_attempts
GROUP BY order_id;
The full current_orders view also retains order value, creation time, payment method, region, error, freshness, and attempt count.
This gives us two useful metrics with different meanings:
| Metric | What it counts |
|---|---|
| Payment attempt success | Successful attempts divided by all attempts |
| Order payment completion | Orders whose latest status is successful divided by unique orders |
A retry can improve order completion while leaving the original provider failure visible. Keeping both metrics helps explain what customers and payment infrastructure experienced.
Defining unpaid value carefully
We defined unpaid value at risk as the value of unique orders created in the reporting window whose latest attempt is unsuccessful and at least 60 seconds old.
That grace period gives the simulated retry a chance to complete. We call the result at-risk unpaid value because the data does not establish that the revenue is permanently lost.
For the native dashboard, the calculation uses a 15-minute order window:
SELECT
    count() AS orders_15m,
    countIf(latest_status = 'success') AS paid_orders,
    round(
        100.0 * paid_orders / nullIf(orders_15m, 0),
        2
    ) AS completion_pct,
    countIf(
        latest_status != 'success'
        AND latest_attempt_at <= now() - INTERVAL 60 SECOND
    ) AS unpaid_orders,
    sumIf(
        amount_inr,
        latest_status != 'success'
        AND latest_attempt_at <= now() - INTERVAL 60 SECOND
    ) AS unpaid_value_inr
FROM revenue_demo.current_orders
WHERE order_created_at >= now() - INTERVAL 15 MINUTE;
Grafana uses its selected dashboard window for the equivalent order KPIs. Its default is 30 minutes, so its totals can differ from the native 15-minute cards even when both are correct.
Using views and materialized views together
The project uses a refreshable materialized view for the stored simulation snapshot and ordinary views for business calculations.
The ordinary views serve as our semantic layer: they define latest order state, provider health, and investigation rules consistently. A semantic layer is a way of organizing business meaning; it can also sit above materialized aggregates in a larger system.
Ordinary views were convenient here because time windows continue moving even when no new insert arrives. A last-two-minute success rate or a 60-second aging condition needs to be evaluated against the current clock. The small rolling dataset also made query-time aggregation a reasonable starting point.
For higher volumes, we would measure query costs and consider incremental materialized views for provider time buckets and latest-order aggregate states. We have not benchmarked that production design.
Building the visual reports
The Grafana report contains 12 panels, including KPI cards, a success gauge, provider comparison, payment volume, p95 latency, provider health, affected orders, and the deterministic investigator. Provider and payment-method controls filter the relevant queries.
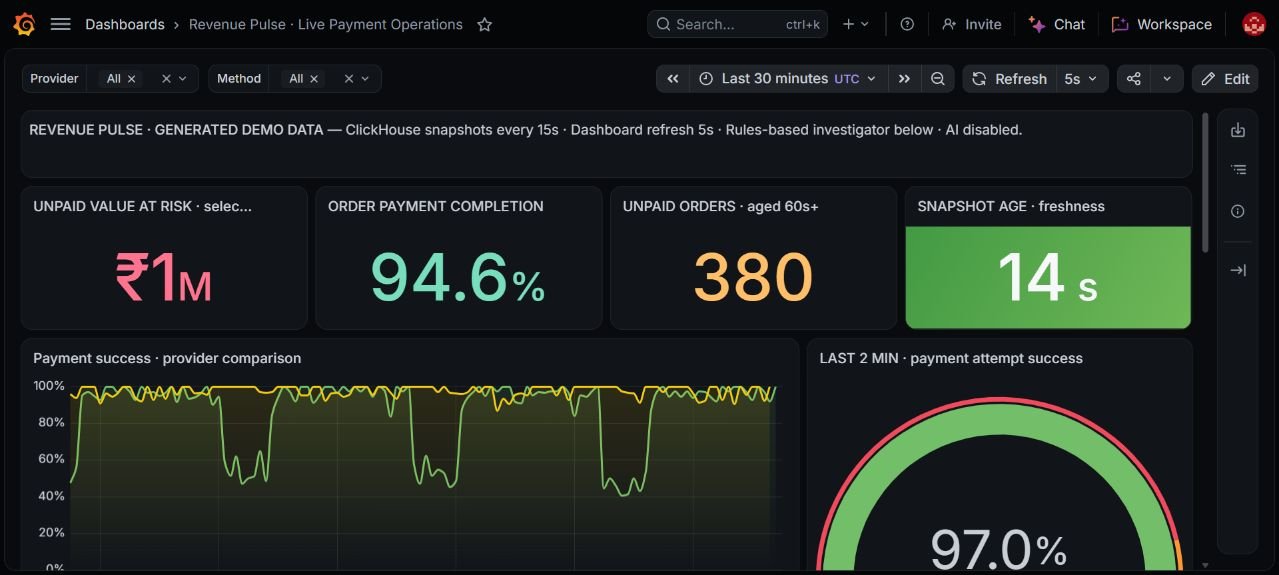
Grafana report showing payment KPIs, freshness, and provider behavior. Values are generated demo observations at capture time.
Grafana refreshes every five seconds. The underlying ClickHouse snapshot changes approximately every 15 seconds, so consecutive dashboard refreshes can show the same source data. We added a snapshot-age card to make that distinction visible.
We also expanded the native ClickHouse report to ten visual elements: four KPI cards, success, volume and latency charts, and three operational tables. Its styling and available controls differ from Grafana. It reproduces the main analytical workflow rather than an identical visual layout.
For volume and latency, 15-second buckets expose the simulated event more clearly than a coarse 15-minute grouping:
SELECT
    toStartOfInterval(attempt_time, INTERVAL 15 SECOND) AS bucket,
    provider,
    count() AS total_attempts,
    quantile(0.95)(latency_ms) AS p95_latency_ms
FROM revenue_demo.payment_attempts
WHERE attempt_time >= now() - INTERVAL 30 MINUTE
GROUP BY bucket, provider
ORDER BY bucket, provider;
The native viewer's refresh interval needed attention. We enabled auto-refresh and set it to 15 seconds, but reopening previously returned it to a 60-second default. Source refresh, viewer refresh, and chart bucket size are separate settings.
Adding investigation rules and a native AI assistant
We first created a deterministic investigation view. It compares recent provider and method performance against a baseline, checks sample size and timeout evidence, and returns a finding plus a suggested follow-up.
For example, it flags provider timeouts when recent success drops sufficiently or falls below 85 percent, with at least ten timeout attempts. A small sample produces an insufficient-sample finding. No triggered rule is not a guarantee of health.
Later, after enabling ClickHouse's native AI feature, we tested conversational investigation against the same data.
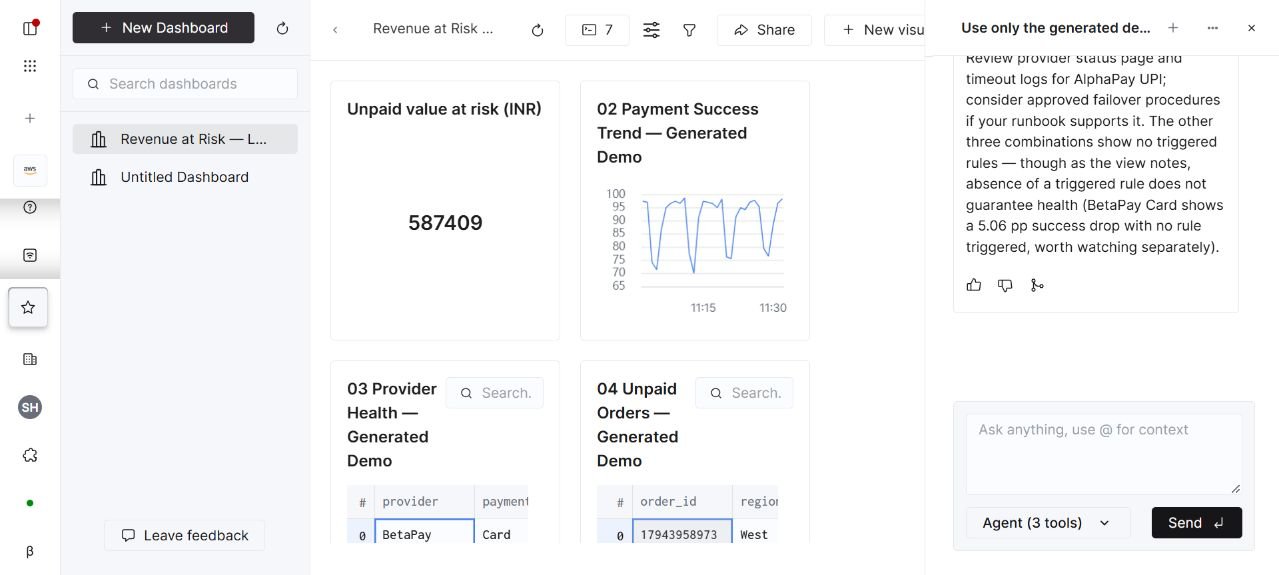
The built-in ClickHouse assistant beside the native report. The assistant and the SQL rules panel are separate features.
We did not build a custom LLM agent. Both ClickHouse Assistant and Grafana Assistant are vendor-provided features. The ClickHouse assistant executed SQL, saved query definitions, and rendered charts in chat. Its responses are answer-time snapshots; they do not automatically become refreshing dashboard panels.
Reviewing the AI output was an essential part of the work. Its first KPI draft omitted the 15-minute order window and 60-second aging condition. We supplied the exact definition, updated the saved query, and validated the corrected result.
We also corrected an explanation that treated latency as a proven cause of failures. The demo showed elevated latency and timeouts together; the report should describe that evidence and suggest checks without claiming a root cause it has not established.
What we checked
We checked data invariants as well as the visual report. One recorded validation run on November 11 returned:
| Check | Recorded result |
|---|---|
| Payment attempts | 14,661 |
| Unique attempt IDs | 14,661 |
| Unique orders | 14,400 |
| Successful retry attempts | 261 |
| Duplicate attempt IDs | 0 |
| Invalid retry statuses | 0 |
| Attempts after their generated timestamp | 0 |
| Snapshot age | 9 seconds |
A separate order-level check found no retried orders still classified as unpaid. These checks ran against separate snapshots, so their results should not be presented as one atomic reconciliation. The nine-second snapshot age is not a replication-latency benchmark.
We verified the Grafana connection health check, live KPI updates, source-age resets, provider filtering, charts, and tables. In ClickHouse, we verified the native report queries and an AI investigation that identified the simulated AlphaPay UPI timeout signal while distinguishing observations from root-cause inference.
We did not perform sustained load testing, production failover testing, or reconciliation against an external payment source.
What a production version would need
The next step would be to replace the SQL simulator with an actual event source:
Checkout service or payment provider
    -> authenticated event collection or source CDC
    -> durable ingestion pipeline
    -> ClickHouse payment event tables
    -> latest order state and provider aggregates
    -> dashboards and controlled AI investigation
That work would need idempotent event handling, duplicate and late-event processing, cancellation and refund semantics, source reconciliation, retention, and freshness monitoring. The analytical connection should use a dedicated restricted identity, and AI query scopes should be reviewed.
Managed Postgres and WalShadow could be evaluated if Postgres were chosen as the application's transactional source. They are not components of the current demonstration.
Lessons from the project
The most useful result was a shared, testable definition of payment health. Latest-order state prevented recovered orders from inflating unpaid value. Explicit windows explained differences between dashboards. Fine time buckets made a short degradation visible. Freshness indicators made the refresh behavior understandable.
The AI assistant added a useful conversational route into the data, but its output still needed review against the SQL definitions. The corrected KPI draft was a practical reminder to make metric scope and business rules explicit in every investigation.
The completed demonstration now provides a reproducible path from changing payment data to operational charts and AI-assisted analysis. The remaining production work starts at the source and ingestion layer.
Further reading and project material
- What I learned from a month with WalShadow on ClickHouse Managed Postgres inspired the structure of this project write-up. Its replication benchmarks are separate from our results.
- The accompanying project handover contains the complete schema, generator, semantic views, dashboard SQL, validation queries, connection settings without passwords, and operating commands.
- The project package includes a silent Grafana walkthrough and selected screenshots. The earlier native recording predates enabling the AI assistant.